
Imagine it’s January 1995. You’ve saved up $26,000. You have two clear options:
Buy a house:
Use the $26,000 as a down payment on a $130,000 home.
Buy stocks:
Invest the full $26,000 in the S&P 500, which represents 500 of the largest companies in the U.S., and leave it untouched.
Why $26,000 = 20% Down
- Home price: $130,000
- Down payment: $26,000
130,00026,000=0.20=20%
So the $26,000 represents a standard 20% down payment, which in 1995 would typically:
- Avoid private mortgage insurance (PMI)
- Leave you with a mortgage of $104,000
Housing Context (1995)
In the mid-1990s, a home priced around $130,000 was very close to the typical U.S. home price, making this a realistic, middle-of-the-road purchase.
Fast Forward
Now jump ahead 30 years to January 2025. The mortgage is paid off, time has passed, and you want to know which choice worked out better.
Many people believe buying a home is the best way to build wealth, mainly because it lets you control a large asset with borrowed money. But the stock market has an often overlooked advantage: dividends that get reinvested over time.
To find out which path came out ahead, we used real stock market data and actual U.S. home prices from the past three decades. The answer isn’t as obvious as most people think.
The Data We Used
To keep this comparison fair, we used real historical data from trusted public sources and looked at the same time period for both investments.
Housing data comes from the U.S. median home price series:
- Title: Median Sales Price of Houses Sold for the United States
- Series ID: MSPUS
- Source: U.S. Census Bureau and U.S. Department of Housing and Urban Development (HUD)
- Release: New Residential Sales
- Seasonal Adjustment: Not seasonally adjusted
- Frequency: Quarterly
Using this data, the median home price was about $130,000 in early 1995 and rose to around $423,100 by early 2025, showing how home prices changed over time.
Stock market data comes from the S&P 500, measured using the SPY ETF from Yahoo Finance. We used prices from January 1995 to January 2025 and included dividends reinvested, which is a key part of long-term stock returns.
Both datasets cover the same 30-year period, which allows for a clear and honest comparison between buying a home and investing in the stock market.
Putting the Two Choices Side by Side
Up to this point, we’ve talked about prices, growth rates, and long-term averages. But sometimes the easiest way to understand an investment is to see the full journey.
The chart below shows what actually happened when we put $26,000 into the S&P 500 versus using $26,000 as a 20% down payment on a home, starting in 1995 and running through 2025. The stock line includes dividends reinvested, while the home line shows how home equity grew as prices increased over time.
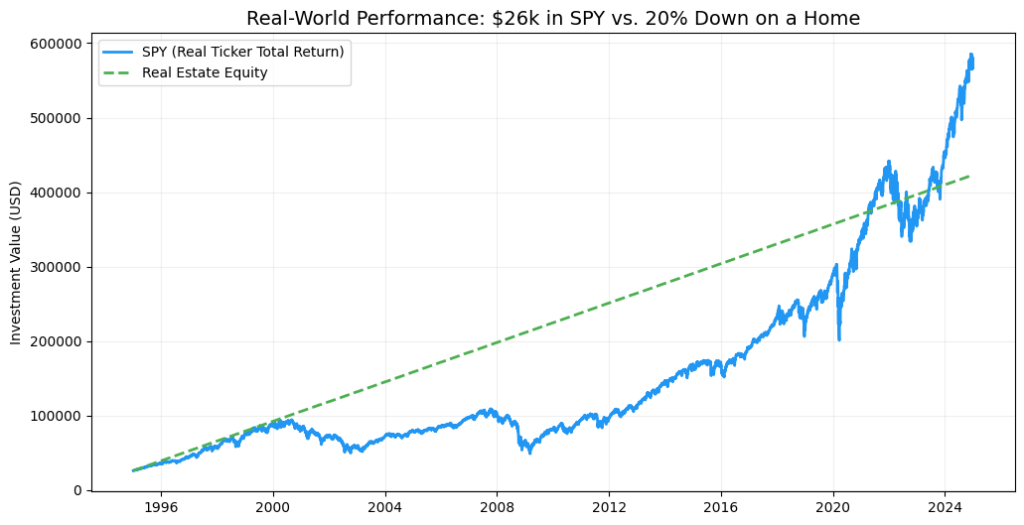
Data Results (1995-01-03 to 2025-01-02)
| Item | S&P 500 (SPY – Dividends Reinvested) | Home (Median U.S. Price) |
|---|---|---|
| Start Date | 1995-01-03 | 1995-01-01 |
| End Date | 2025-01-02 | 2025-01-01 |
| Initial Investment | $26,000 | $26,000 (20% down) |
| Starting Price | $26.58 (SPY Adj Close) | $130,000 (home price) |
| Ending Price | $579.28 (SPY Adj Close) | $423,100 (home price) |
| Final Value / Equity | $566,544 | $423,100 |
Conclusion
This table shows the results of two choices made over the same 30-year period, starting in 1995 with $26,000.
When the money was invested in the S&P 500, with dividends reinvested, it grew from $26,000 to $566,544 by early 2025. That is a gain of about $540,544, which equals roughly +2,080% total growth.
When the same $26,000 was used as a 20% down payment on a home, the home’s value grew from $130,000 to $423,100. That results in $423,100 of equity, which is about +1,530% total growth on the original cash.
Both options grew substantially over time, but the stock investment ended much higher in dollar terms and percentage growth. The main reason is compounding—especially dividends being reinvested year after year.
This doesn’t mean buying a home is a bad decision. A home provides shelter and stability. But when looking purely at long-term financial growth, this data shows that investing in the S&P 500 produced a larger increase from the same starting amount over the same time period.