
If you’ve looked at tech stocks over the past decade, you’ve probably heard of QQQ. It tracks the Nasdaq and holds many of the biggest technology companies in the market.
But there’s another version called TQQQ that is something much bigger: three times the daily movement of the Nasdaq. When tech stocks rise, TQQQ can climb very fast. When they fall, it can drop just as quickly.
In this post, we’re going to compare TQQQ vs. QQQ side by side. We’ll look at how $10,000 would have grown in each, how they behaved during market crashes, and why leverage can be both powerful and dangerous.
By the end, you’ll have a clearer idea of what makes these two funds so different—and which type of investor each one is really meant for.
Important Disclaimer About Leveraged ETFs
TQQQ is a leveraged ETF, which means it uses financial tools like borrowing and derivatives to amplify daily returns. Because of this:
- TQQQ is designed for short-term trading, not long-term investing
- Its returns can drift away from the Nasdaq over time
- Large market drops can cause very deep losses
- Long periods of volatility can reduce returns even if the market later recovers
QQQ does not use leverage and is generally considered a long-term investment, while TQQQ carries much higher risk and requires close attention.
This comparison is for education only. It is not investment advice, and leveraged ETFs may not be suitable for all investors.
With that in mind, let’s look at how these two funds actually performed—and what the numbers really show
TQQQ vs. QQQ: The Power — and Risk — of Leverage
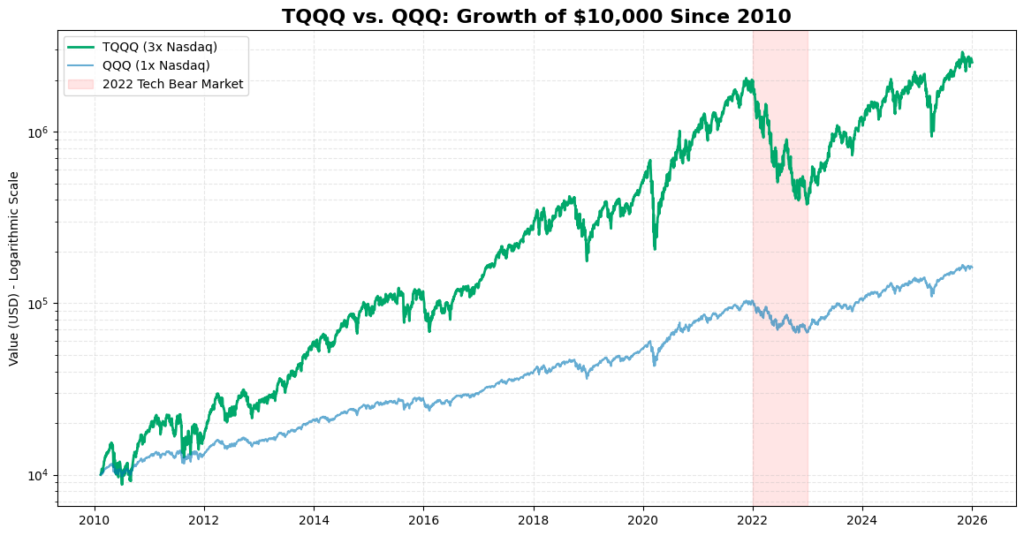
This chart compares two ways of investing in the Nasdaq:
- QQQ tracks the Nasdaq normally (1× exposure).
- TQQQ aims to deliver 3× the daily move of the Nasdaq using leverage.
Both start with the same $10,000 in 2010, but they take very different paths.
16-Year Total Returns: TQQQ vs. QQQ
Starting Investment: $10,000
| Ticker | Strategy | Final Value | Total Growth |
|---|---|---|---|
| TQQQ | 3× Nasdaq (Leveraged) | $2,536,386.86 | +25,264% |
| QQQ | 1× Nasdaq | $161,552.77 | +1,516% |
What This Analysis Includes
This analysis compares TQQQ and QQQ using:
- Time period: February 2010 → January 2026
- Starting amount: $10,000
- Data source: Yahoo Finance
- Prices: Adjusted (splits and dividends included where applicable)
- Method: Buy-and-hold, no additional contributions
The chart uses a logarithmic scale, which is important when comparing leveraged funds over long periods. It allows early drawdowns and later explosive growth to be seen clearly on the same chart.
The shaded red area highlights the 2022 tech bear market, one of the toughest periods for leveraged Nasdaq exposure.
How to Read These Results
The gains came with extreme volatility. TQQQ suffered massive drawdowns, especially during major selloffs like 2022.
QQQ delivered strong long-term growth, turning $10,000 into about $161,000 over 16 years.
TQQQ, using 3× daily leverage, turned the same $10,000 into over $2.5 million — but only because the Nasdaq experienced long, powerful bull markets during this period.
TQQQ vs. QQQ vs. SPY: How Leverage Changed Everything
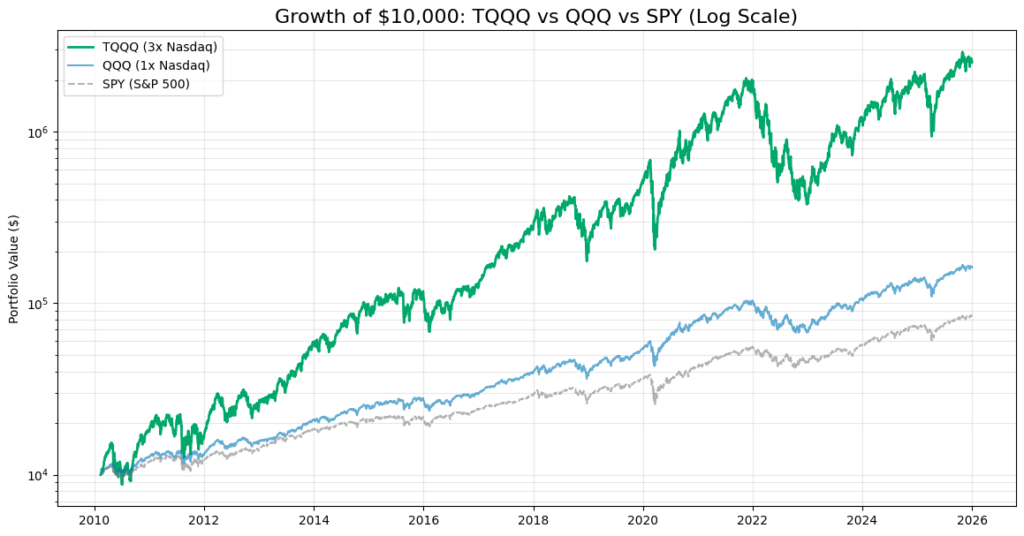
This chart compares three ways of investing $10,000 starting in 2010:
- SPY tracks the S&P 500
- QQQ tracks the Nasdaq
- TQQQ uses leverage to deliver 3× the daily move of the Nasdaq
The chart uses a logarithmic scale, which helps compare growth fairly over long periods. Each line shows how the same $10,000 grew over time, even though the final values are very different.
What This Chart Shows
The gray line (SPY) shows steady, long-term growth. It moves slower, but with fewer extreme swings.
The blue line (QQQ) grows faster than SPY, reflecting the strong performance of tech stocks.
The green line (TQQQ) grows the fastest by far, but with very sharp drops along the way.
You can clearly see major downturns, especially around 2022, when tech stocks fell hard. During these periods, TQQQ dropped much more than QQQ or SPY, showing how leverage increases both gains and losses.
Long-Term Risk and Return Comparison
| Ticker | CAGR (%) | Volatility (%) | Max Drawdown (%) | Best Year (%) | Worst Year (%) |
|---|---|---|---|---|---|
| QQQ | 19.14% | 20.64% | -35.12% | 54.86% | -32.58% |
| SPY | 14.35% | 17.20% | -33.72% | 32.31% | -18.18% |
| TQQQ | 41.68% | 61.10% | -81.66% | 198.05% | -79.09% |
What These Numbers Mean
CAGR (Average Yearly Growth)
- TQQQ grew the fastest, by a wide margin.
- QQQ grew faster than SPY because tech stocks outperformed.
- SPY grew the slowest, but still delivered strong long-term returns.
Volatility (How Wild the Ride Was)
- TQQQ was extremely volatile — prices moved a lot, very fast.
- QQQ had noticeable swings, but far less than TQQQ.
- SPY was the calmest of the three.
Max Drawdown (Worst Peak-to-Low Drop)
- TQQQ lost more than 80% at its worst point.
- QQQ and SPY both saw drops around 33–35%, which is painful but survivable for many investors.
Best and Worst Years
- TQQQ had massive upside in good years (nearly 200% in its best year).
- But it also had brutal down years, losing almost 80% in its worst year.
- QQQ and SPY had much smaller best and worst years, showing more stability
Final Conclusion
These numbers show that higher returns always came with higher risk.
TQQQ delivered the strongest growth by far, but it also came with extreme swings and very deep losses. An investor had to sit through drops of more than 80%, which is something most people cannot handle in real life.
QQQ offered a middle ground. It delivered strong long-term growth without the extreme volatility seen in TQQQ. The drawdowns were painful, but they were more manageable for long-term investors.
SPY was the most stable choice. It grew more slowly, but it had the smallest swings and the mildest down years. For many investors, that stability matters more than chasing the highest return.
DISCLAIMER: NOT FINANCIAL ADVICE
The content on this blog (including all text, data, code, and charts) is provided for educational and informational purposes only. I am not a licensed financial advisor, investment builder, or tax professional.
Investments involve risk: The stock market is volatile, and you can lose part or all of your investment. Past performance is not a guarantee of future results. Any tickers mentioned are used as examples of historical data analysis and are not recommendations to buy or sell.
Do your own research: Before making any financial decisions, you should conduct your own due diligence or consult with a qualified financial professional. Use of the Python code provided in these posts is at your own risk; I am not responsible for any financial losses or technical errors resulting from the use of this information.